Customer engagement metrics are like the heartbeat of your business—they reveal the health of your relationships with your customers.
If you don’t keep an eye on your customer, you will miss insights about the customer, which otherwise can help you orchestrate the customer journey, create campaigns, and make data-driven decisions.
Did you know that companies tracking customer engagement metrics can see up to a 23% increase in profitability? Understanding how your customers interact with your brand isn’t just beneficial—it’s essential.
We know the attention span of customers is shorter than ever, so monitoring how connected your customers feel can make the difference between standing out and blending into the crowd.
So, let’s understand the 10 customer engagement metrics you need to track which are relevant to almost any campaign and keep your business growing.
Table of Contents
ToggleLet’s understand the Meaning of Customer Engagement Metrics
Customer engagement metrics measure the relationship between how customers interact with your business and its products and services. Customer engagement can help you build your customer loyalty, customer satisfaction and purchasing behavior.
The customer tends to switch from one brand to another very quickly with even a single unsatisfactory experience, so these user engagement metrics will help you understand how customers interact, communicate and connect with the brand over time.
Customer engagement metrics analysis is the process of using these key KPIs to study how customers engage with a brand.
10 Key Customer Engagement Metrics to Measure in 2024
When measuring customer engagement metrics it takes the entire customer lifecycle into consideration, which is why measuring user engagement is objectively challenging. To understand and analyses it, a brand needs to look at a broader picture and various customer interactions and make an attempt to drive meaning out of it.
1. Conversion Rate
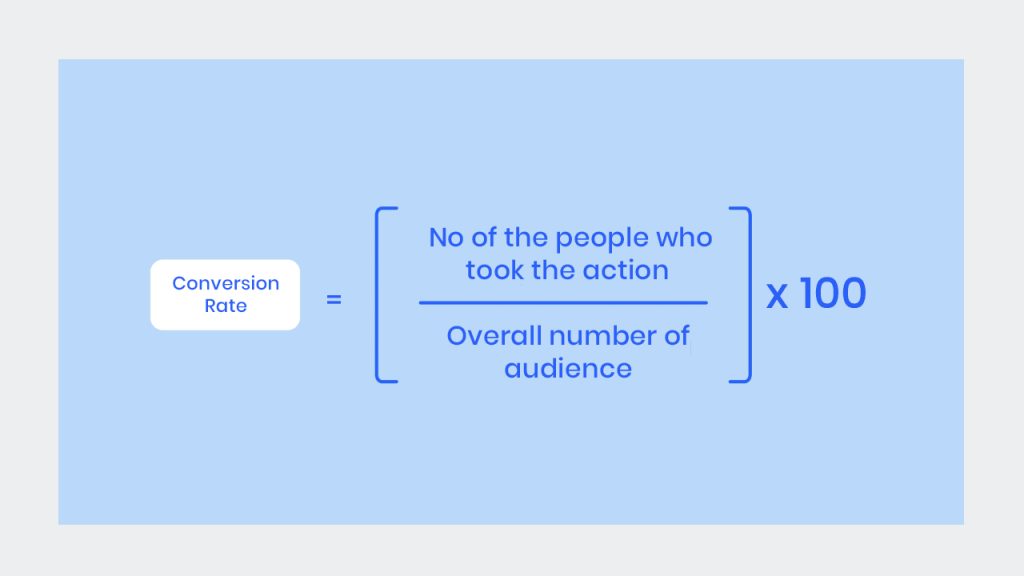
Customer engagement metrics- The conversion rate will measure the percentage of people who have completed the action as defined in your campaign goal.
Examples of conversion goals are:
1. User signing up for your email newsletter
2. Making a purchase
3. Downloading an app
4. Downloading an e-book or many other objective.
The conversion rate is directly proportional to your marketing strategy. The definition of conversion varies from campaign to campaign, but the conversion rate is easier to calculate.
Conversion Rate Formula is :

Conversion rates in customer engagement metrics are important to measure the success of your campaign especially when you are particularly running mobile user acquisition. Conversion rate helps you set ROI expectations when scaling a campaign.
Conversion rate not only measures the clicks but also helps you define and identify the event’s conversion down the funnel.
For example: With the help of conversion rate, it is possible to calculate the percentage of users who went from installing the app to completing the in-app action.
2. Customer Satisfaction Score
The Customer Satisfaction Score is a customer engagement metrics that is used to measure the satisfaction level of customers with their interaction with the brand or overall experience.
To calculate the customer satisfaction score, these are gathered through survey questions. Generally, users are asked to rate their satisfaction on a scale of 1 to 5 by asking questions such as, “How much would you like to rate our delivery service” or “How satisfied were you with your experience”?
The formula of CSAT is:

On a scale of 1 to 5, 4 & 5 are considered a satisfactory score, So if 75 out of 100 people have scored more than 4 or 5, your CAST score will come to around 75%.
3. Customer Lifetime Value (CLTV)
CLTV is a customer engagement metrics that help you measure the total future revenue generated by customers over their lifetime relationship with the customer. It represents how much each customer is worth to you.
Customer lifetime value not only measures how much they have spent but also helps you identify the group of customers who are making valuable investments in your company and it will help you identify your loyal customer.
To calculate CLTV, the formula is:

CLTV = Average Order Value × Average Purchase Frequency Rate × Average Customer Lifespan.
CLTV does not measure the quantity but the quality of customer engagement. CLTV helps you increase customer satisfaction and user engagement and channels your strategies to keep high-value customers satisfied.
4. Customer Acquisition Cost
Customer Acquisition Cost in customer engagement metrics means the total amount of cost incurred while acquiring a new customer including all marketing and sales expenses.
To calculate the CAC divide the total marketing and sales expenses incurred by the total number of new customers acquired during the specific period of time.
To calculate CAC:
Customer Acquisition Cost helps a company calculate the ROI from your acquisition., and the value of the customer to the organisation.
Jordan T.McBride writes:
“Customer acquisition cost is designed to measure and maintain the profitability of your acquisition teams. If your costs to get the customer through the door are higher than your Customer Lifetime Value, then the business cannot be viable. The best rule of thumb is to be spending 33% or less of your customer’s lifetime value.”
5. Net Promoter Score (NPS)
Another customer engagement metrics NPS ( Net Promoter Score) is a kind of survey that is used to measure customer loyalty and how likely your customer would recommend your brand to others.
This metric will help you understand how satisfactory your product is to your customer’s needs. This can be identified by asking one key question: “On a scale of 0 to 10, how likely are you to recommend our product or service to others”?
Based on the responses of the customers, they are categorised into three broad categories.
1. Promoter (9-10) Loyal customers who are more likely to promote your brand
2. Passive(7-8) Satisfied customer but less likely to promote your brand
3. Detractors (0-6) Unhappy customers who will not promote your brand and the possibility is they can bad mouth the brand.
To calculate the NPS:

Take an example say your promoter score is 70% and 40% are people who decline to recommend your brand, your NPS score would be 30.
Tracking your NPS will help you see if the customer is accepting or declining your service or brand. If they are declining to recommend (detractors) try to understand their problem and fix what causing it.
A high NPS means your customer is satisfied and will stay loyal, and a low NPS indicates there is room for improvement.
6. Churn Rate
Customer churn rate is an important customer engagement metrics that measure the percentage of customers who have stopped doing business with your brand over a specific period of time.
Customer churn rate is important to understand and it identifies the area for improvement. A high churn rate is a red flag that reflects customer dissatisfaction.
The formula to calculate the churn rate is :

Lower the churn rate better the engagement and satisfaction. To maintain the lower churn rate dig into why customers are leaving and address the complaints and issues raised by customers.
7. Customer Retention Goal
One of the highly relevant customer engagement metrics is retention metrics which measure the number of customers a company has retained over a period of time.
It can be calculated by subtracting the number of new customers acquired during the period from the total number of customers at the end of the period, dividing that by the total number of customers at the start of the period, and multiplying by 100.
Customer Retention formula:

It’s important to understand these user engagement metrics for brands looking to retain existing customers as it is often more cost-effective to acquire new ones.
8. Customer Efforts Score (CSE)
This customer engagement metrics- Customer Effort Score is a score that measures how easily it is for customers to interact with your brand and its product and services at any touch point whether it is during the purchase of a product, resolving an issue, or getting an answer.
CES score is collected by asking a relevant question that customers can answer using a sliding numerical scale (typically of 1to5 or 1-7). Lower efforts score correlated with higher customer satisfaction and loyalty.
To calculate the CSE, divide the sum of all scores with no of the total response.

Brands can improve the user engagement metrics- CSE by making it easier for customers to find the information and complete action, increase the no of customer support channels, and provide a self-service option like FAQs, a knowledge base or chatbots of instant query resolution.
9. Cart Abandonment rate
Another customer engagement metrics- Cart Abandonment rate measures the percentage of users who left the purchase journey midway leaving the item in the cart without making the purchase.
A high rate of card abandonment is a red flag and could possibly indicate that their an issue in your pricing, check-out process, or shipping cost or payment gateway.
To calculate the Cart Abondmnet Rate we divide the no of transactions that customers completed by No of shopping carts created and left to determine the percentage multiplied by 100
The formula to calculate cart abonnement rate:

It is important to lower the cart abonnement rate, to do so understanding the reason is important. There are reasons like complicated check-out process or issues in the payment gateway which may be factors but there are other distractions like a simple call or message that can easily distract the user from getting them check-out.
It is important to target them and send them a reminder with discounts or coupons. These tactics can be a helpful nudge to users and help them reduce the cart abatement rate.
10. Monthly/Daily Active Users
Active Users is a customer engagement metrics that measures the number of users that use your brand’s platform, app, or services over a specific period of time. Active users are divided broadly into 3 categories:
1. DAU (Daily Active Users)
2. MAU (Monthly Active Users)
3. WAU (Weekly Active Users)
DAU, MAU, and WAU measure the daily monthly and weekly active usage of apps, software and platform. Higher ratios indicate strong engagement and retention of users.
The formula to calculate:

MAU Rate = Number of monthly active users / Total no of users
DAU Rate = Number of daily active users / Total no of users
WAU Rate = Number of weekly users/ Total no of users
These metrics help brands understand the percentage of users who are actively engaging with their brand regularly. These customer engagement metrics help you identify the gaps in user engagement and find out how to increase retention.
Final Thoughts
Keeping an eye on these customer engagement metrics is like tending to a garden—with regular care and attention, your relationships with customers will blossom.
Keep in mind, that every interaction with your users is an opportunity to build a loyal relationship with them and support growth. It is critical to understand how you can use each metric to actually help you under user engagement with your brand in a meaningful way.
So, don’t let your business run on autopilot. Stay connected with your user, be proactive, and watch your relationship with your customer transfer into lasting partnerships. After all, a business is only as strong as the customers who believe in it.
Read Also: What is Customer Enagagement Score? A Comprehensive Guide.
Written By – Alisha Limichana
Alisha Limichana is a seasoned growth marketer and part of the MCG team at EnR Cloud, specializing in driving business growth through innovative strategies. She has a proven track record of delivering impactful marketing campaigns. Outside of work, Alisha enjoys exploring the mountains, travelling, and staying active and fit.


